European Breeding Bird Atlas 2Distribution, Abundance and Change
原价为:$115.20。$86.40当前价格为:$86.40。
作者
有库存
原价为:$115.20。$86.40当前价格为:$86.40。
重量
5 kg
尺寸
24 × 31 厘米
语言
English
格式
精装
页面
967
出版日期
December 2020
出版商
Lynx Edicions
作者
说明
正确确定鸟类在这个不断变化的世界中的位置,对于保护鸟类至关重要,而要在全大陆范围内做到这一点,只有在强烈的国际合作意愿下才能实现。 为此,欧洲鸟类普查理事会(EBCC)组织了一个鸟类专家网络,以推动整个欧洲的鸟类地图集工作。
欧洲鸟类理事会于 1997 年出版的第一部《欧洲鸟类繁殖图集》(EBBA1)是欧洲鸟类学的一个里程碑。 第二个欧洲鸟类繁殖图集(EBBA2)项目由来自 48 个国家的 EBCC 伙伴组织网络实施。 总共约有 12 万名实地工作者为该地图集提供了数据,其中绝大多数是自愿提供的。 因此,该项目是有史以来最大的生物多样性公民科学项目之一。 数据收集和分析工作遵循严格的科学规程,由来自鸟类研究所、具有多年地图集工作经验的研究人员团队领导。
巨大的实地考察工作使欧洲生物多样性地图集的地理覆盖范围达到了前所未有的程度,包括乌拉尔山脉和里海在内的所有地区,而这些地区在欧洲生物多样性地图集1中都没有得到很好的覆盖。 这些数据主要是在 2013 年至 2017 年期间收集的。
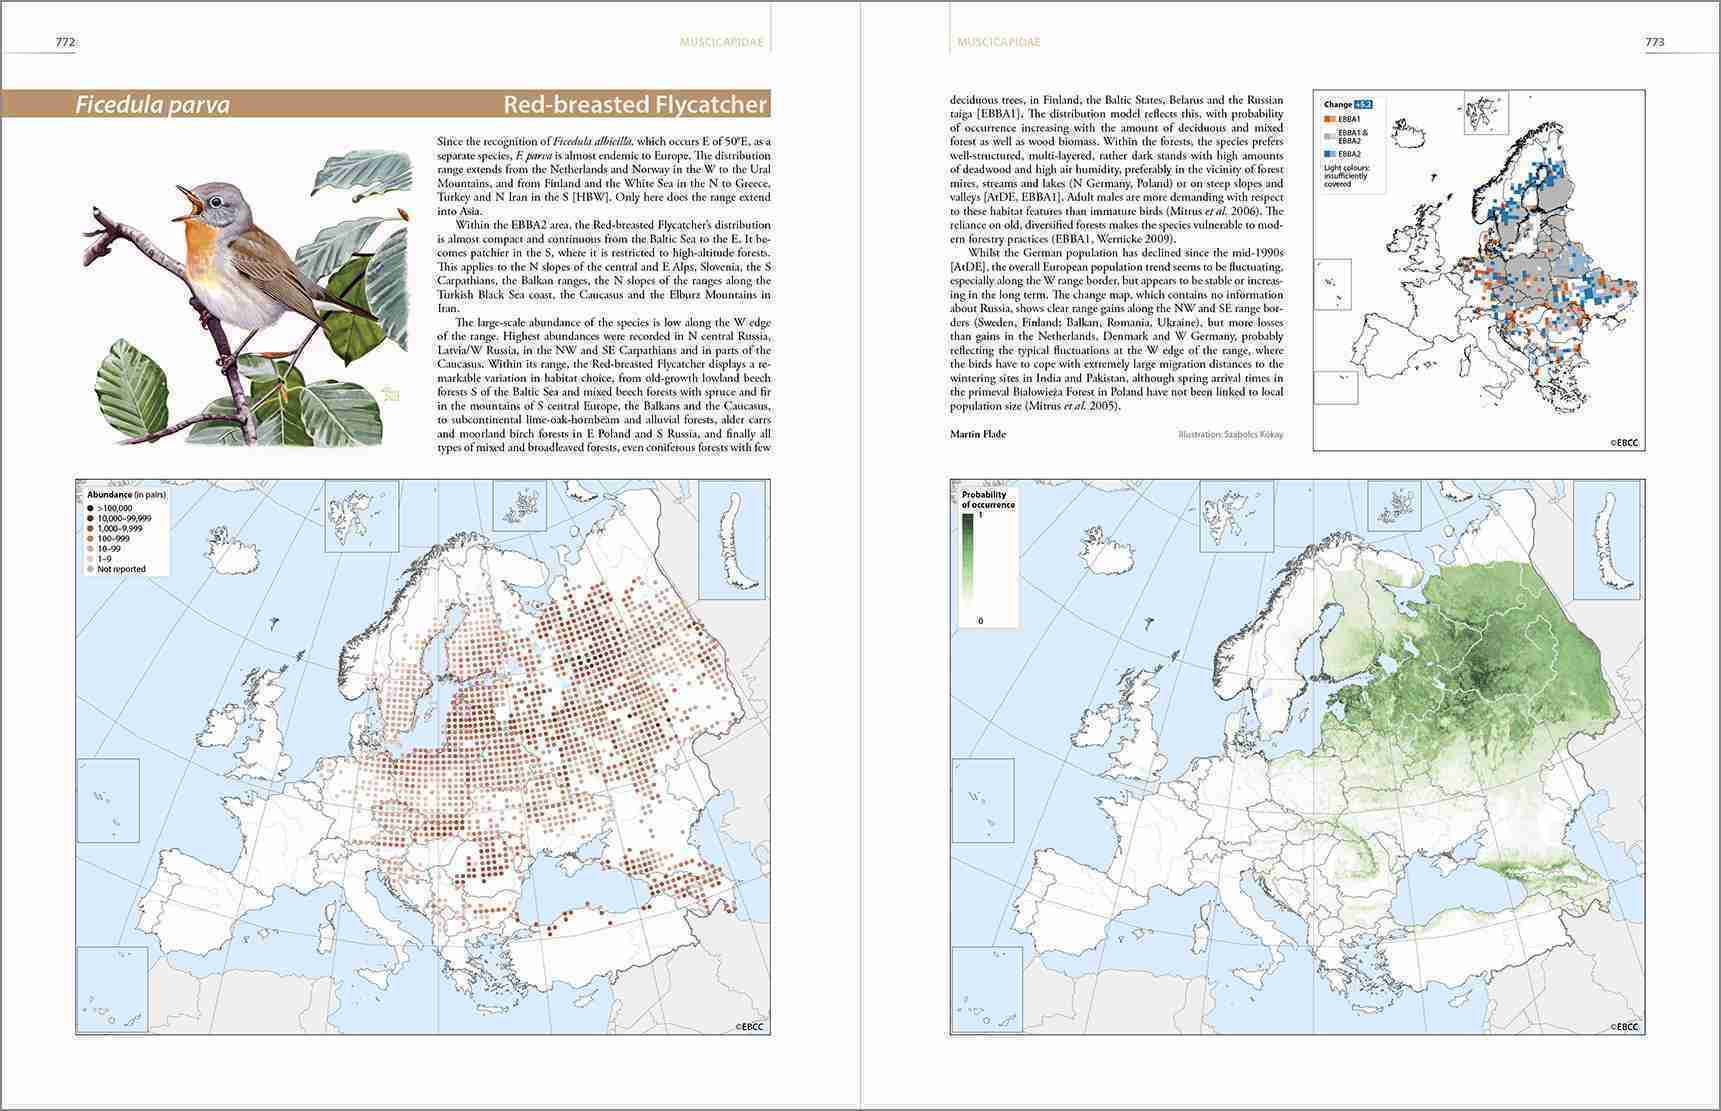
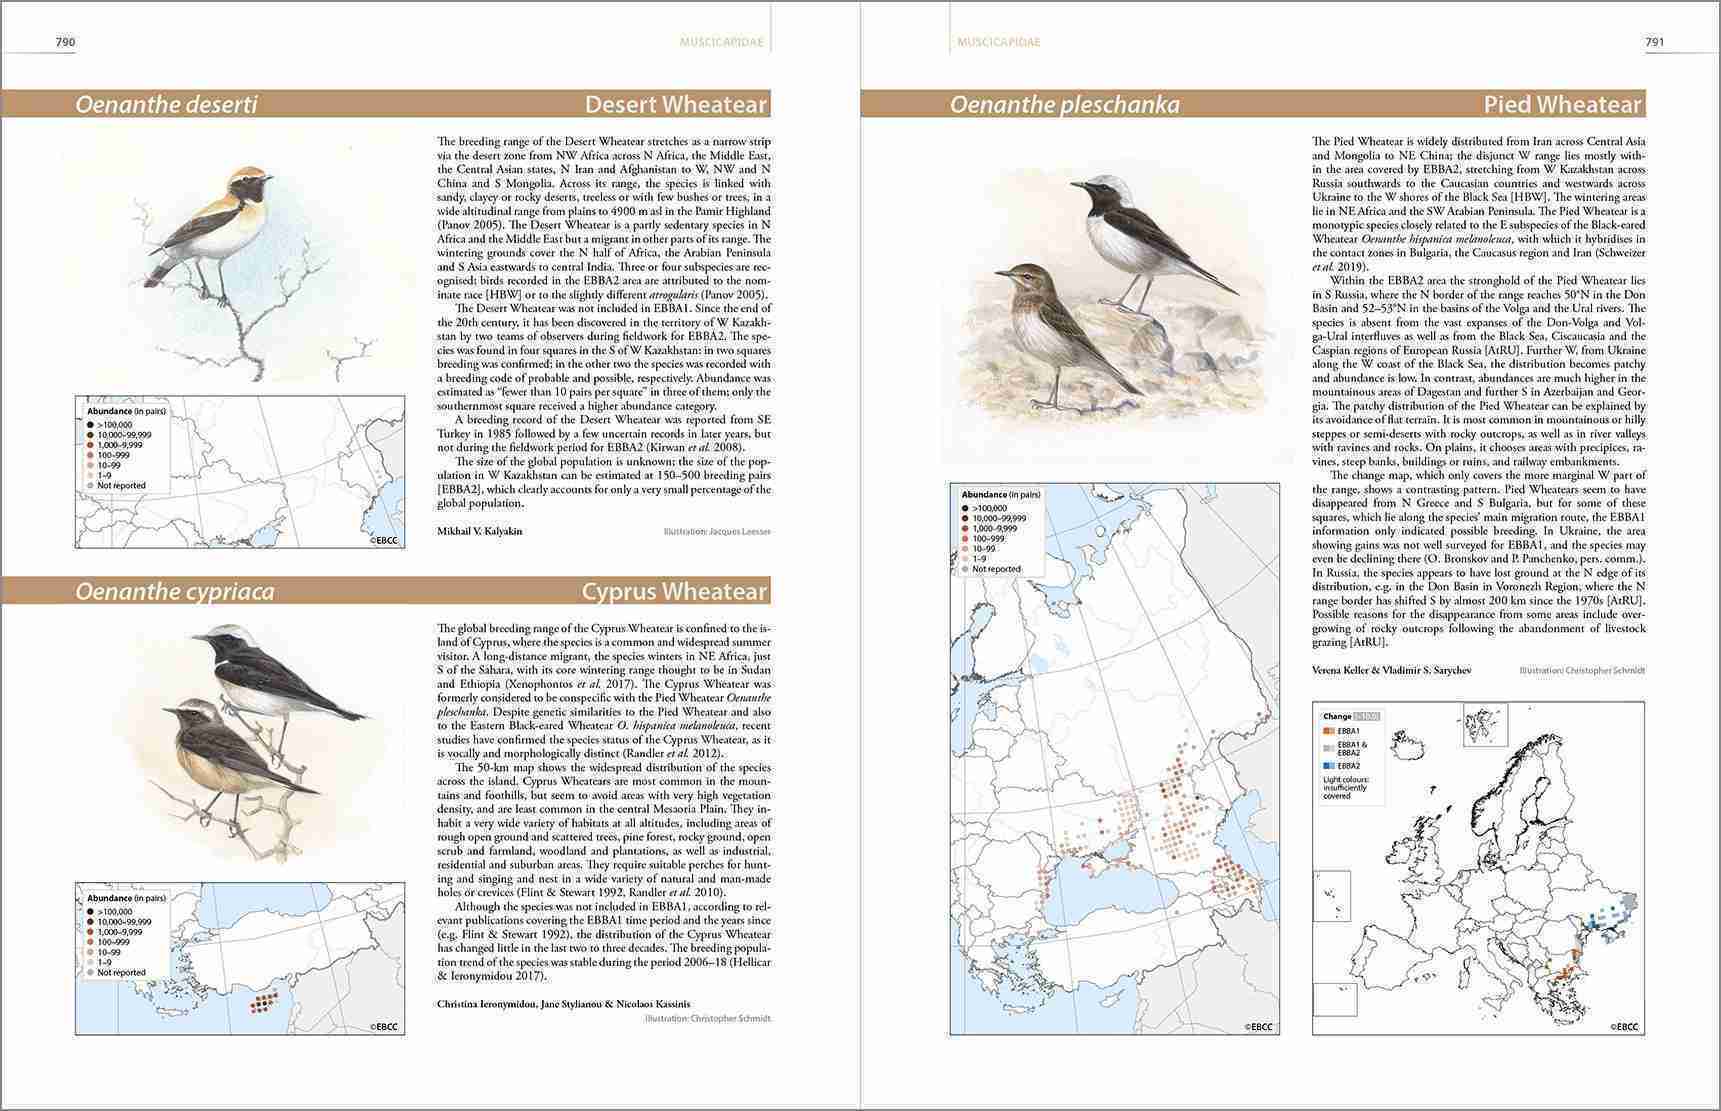
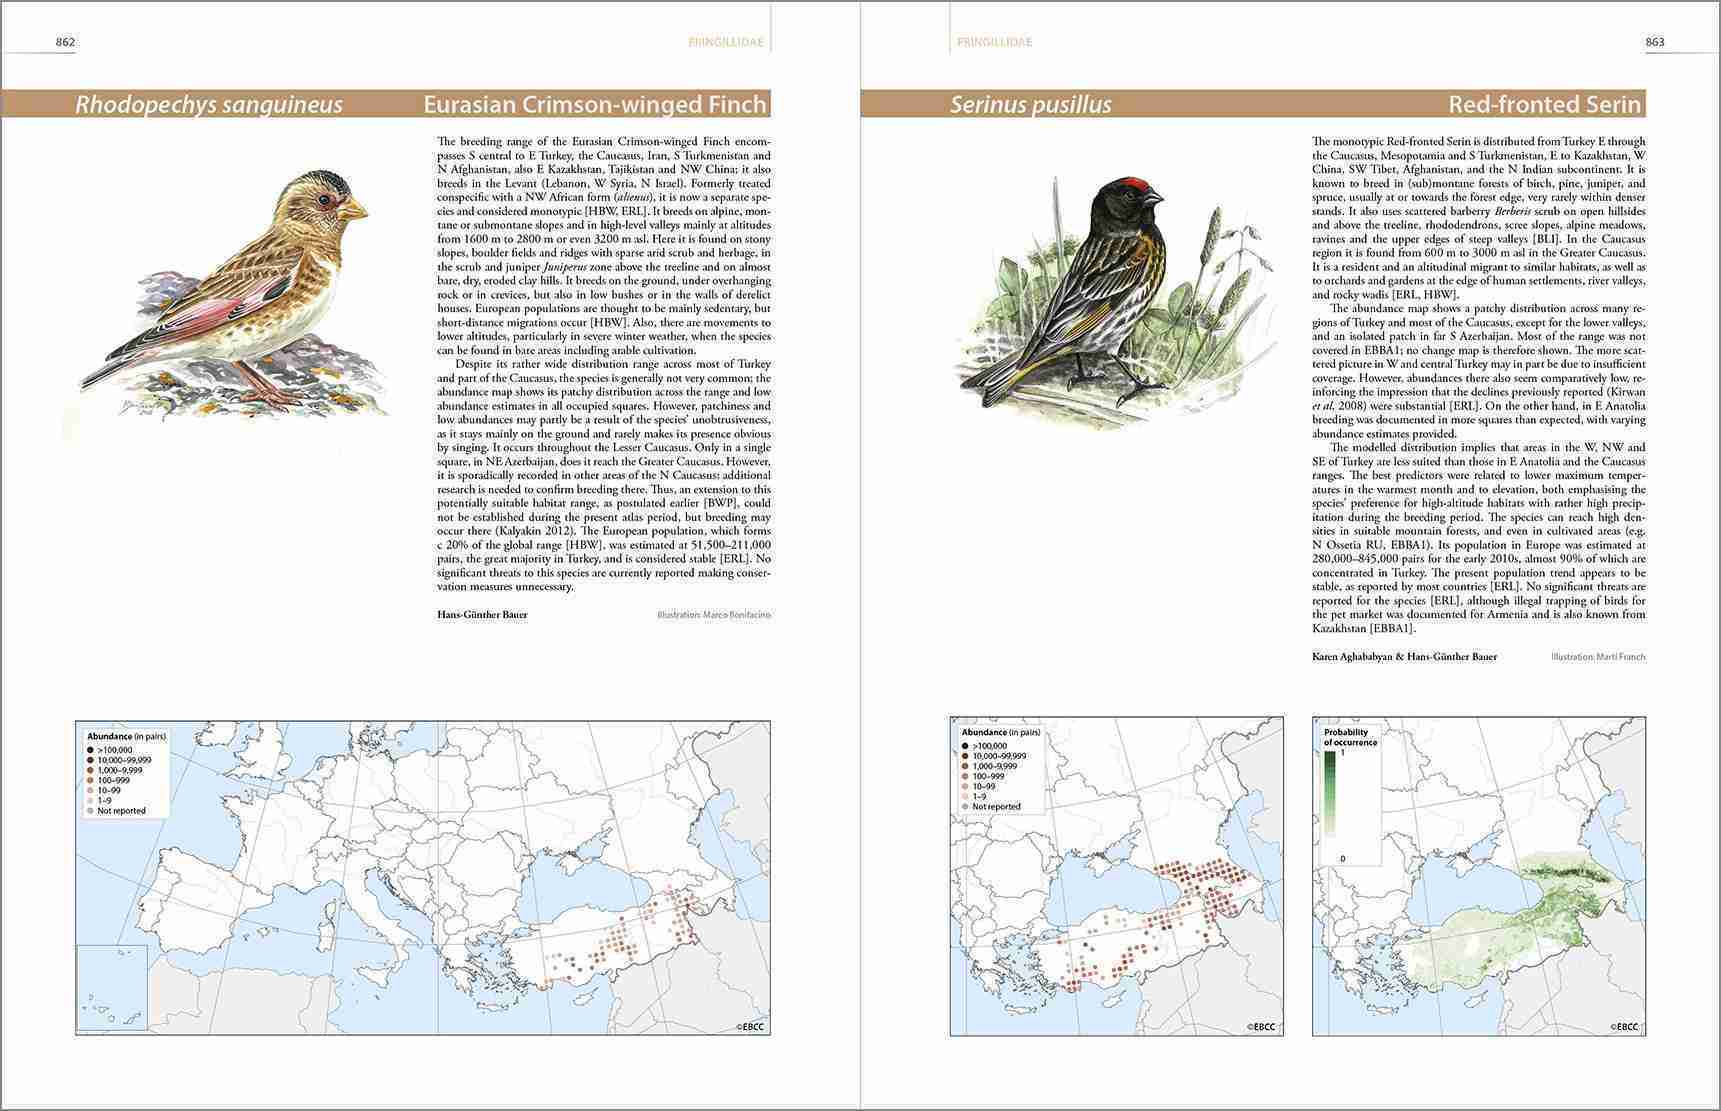
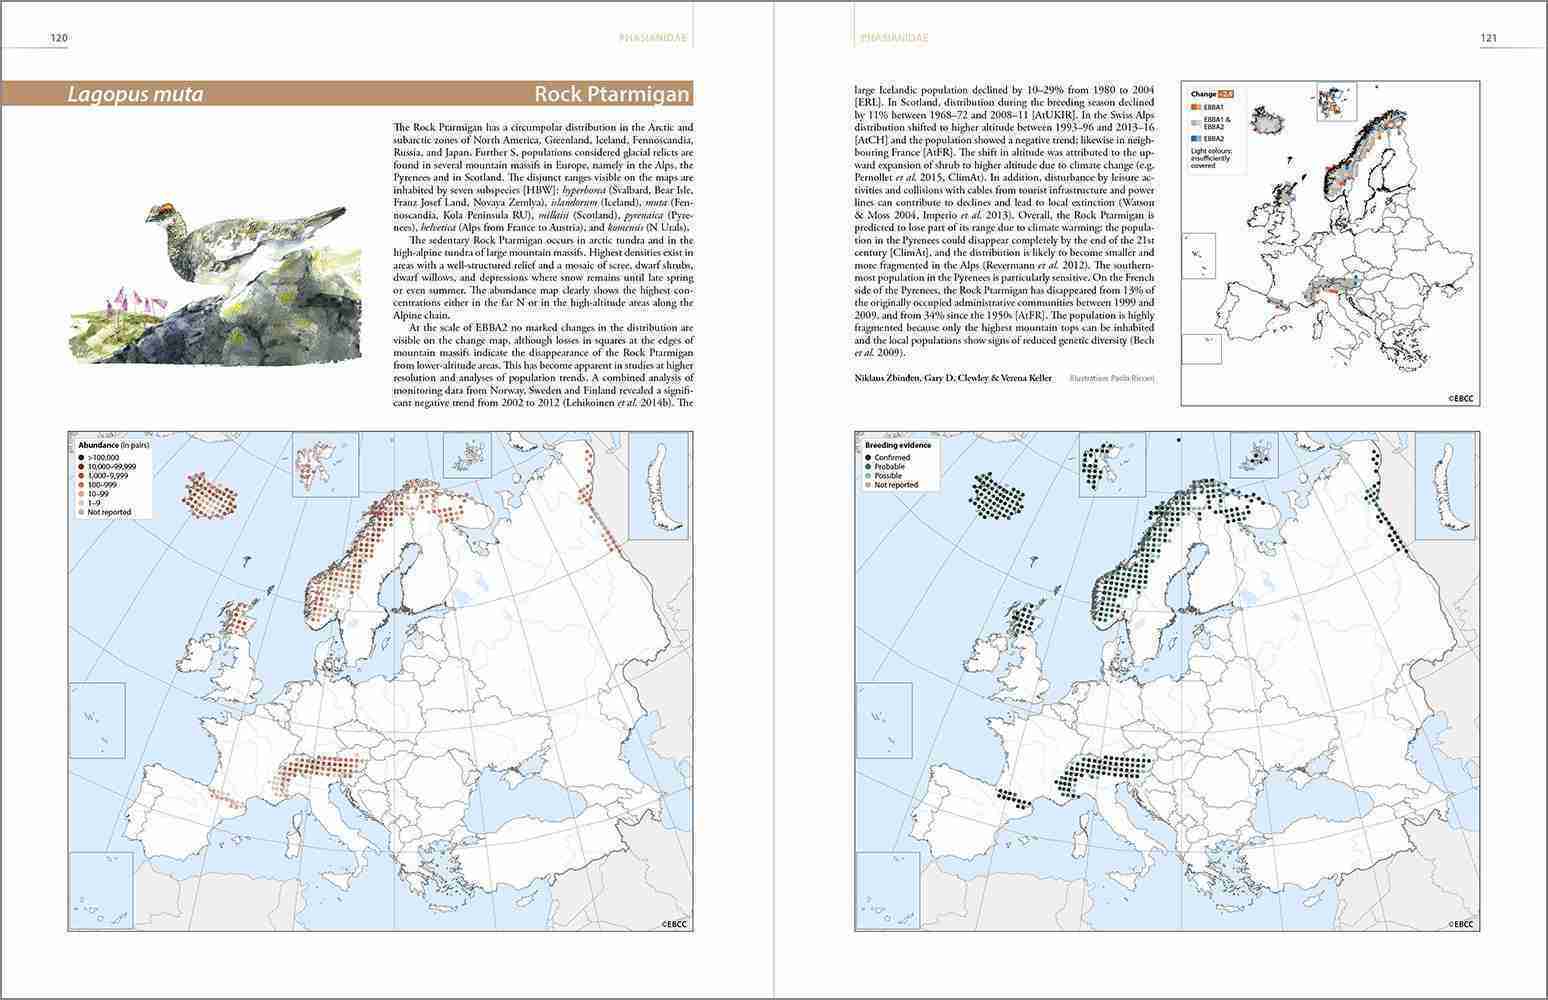
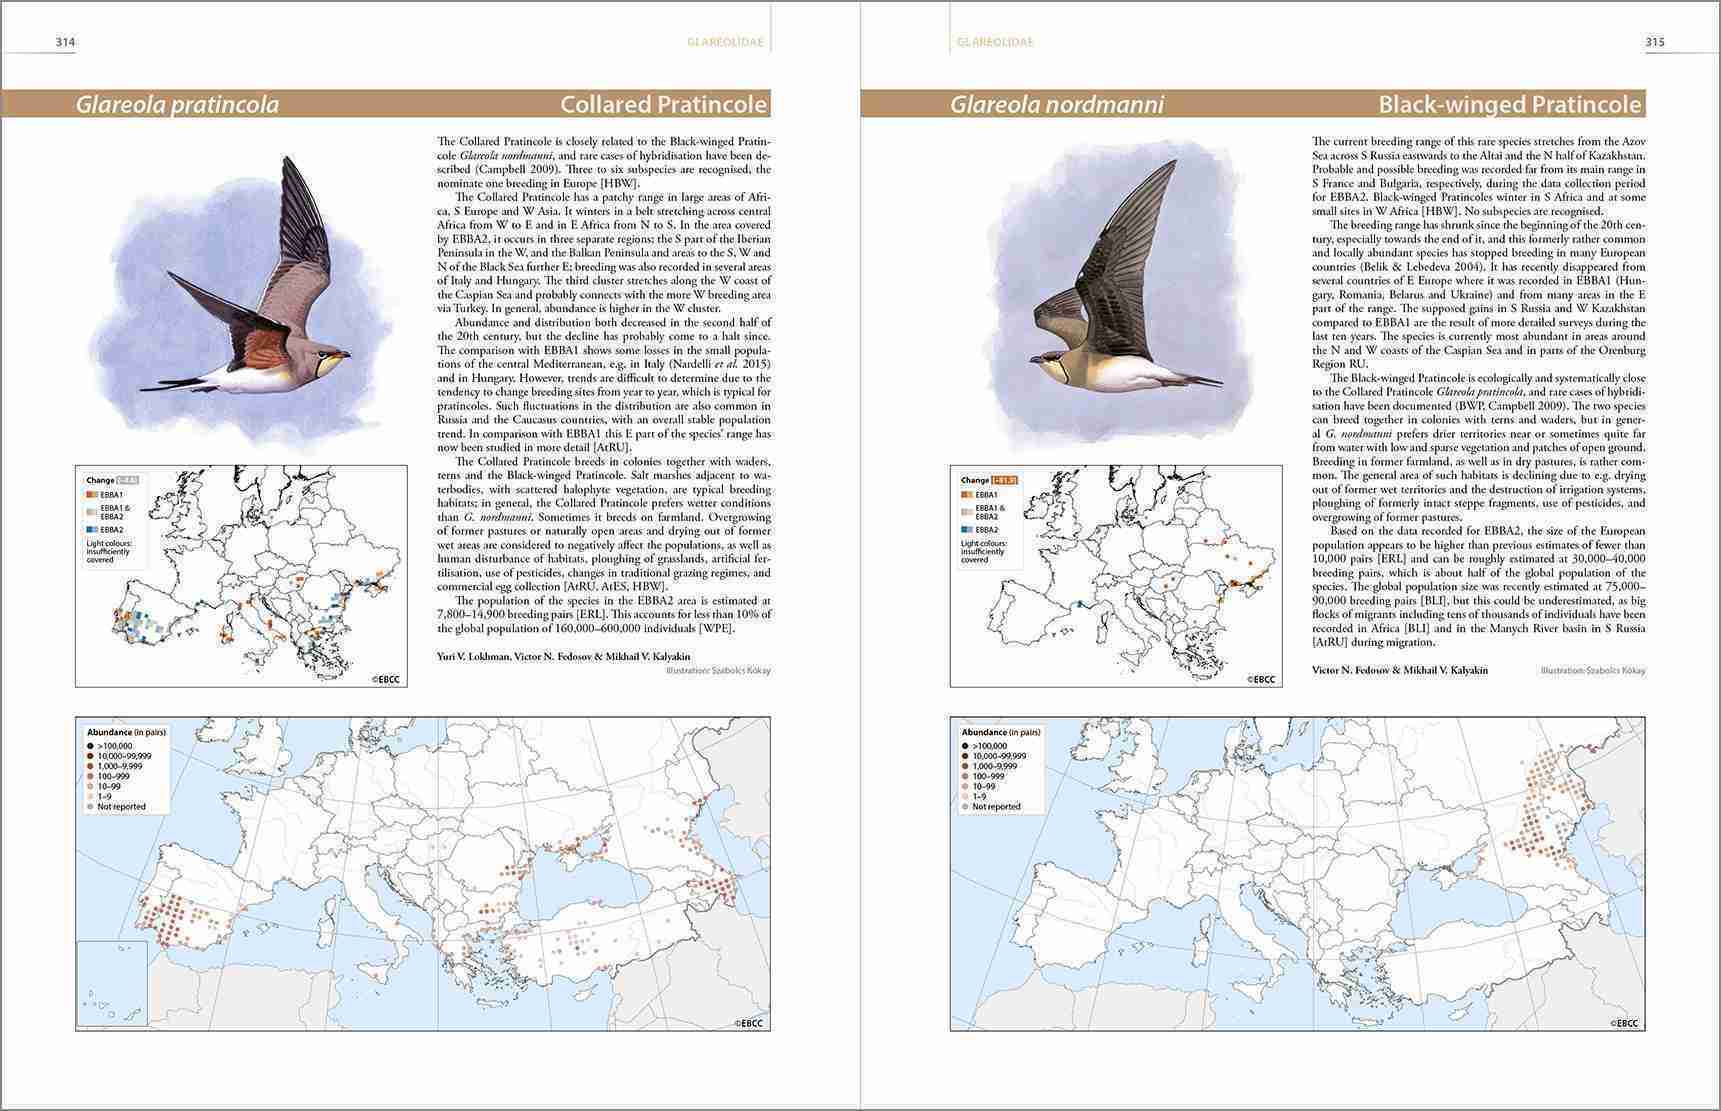
书中介绍了研究期间报告繁殖的所有物种,以及一些繁殖状况较为不确定的物种。 该书共介绍了 556 个物种,并附有完整的物种介绍,包括地图、文字和插图;69 个非常罕见或不定期繁殖物种的信息载于附录。 完整的物种介绍包括分辨率为 50×50 千米的分布图(通常显示丰度数据)、分辨率为 10×10 千米的模型分布图(针对 222 种繁殖鸟类)以及记录自第一版地图集以来分布变化的变化图。
原创插图对所有物种进行了全面介绍。 插图由来自 18 个国家的 46 位艺术家提供,风格和技巧各不相同,反映了欧洲的多样性。
本书是有关欧洲鸟类分布和变化的最新资料来源,也是对了解生物多样性以确保其保护这一全球目标的巨大贡献。
European Breeding Bird Atlas 2Distribution, Abundance and Change 有 2 个评价
作者
Related Books


Gehan de Silva Wijeyeratne –
The European Breeding Atlas 2: Distribution, Abundance and Change (EBBA2) is destined to become one of the most heavily cited ornithological publications in the European region. Spanning 48 countries, it is a monumental work and will be a key baseline that informs future conservation policy and actions. Although it is a data-centric publication with data collected in a standardised and systematic manner, the information has been written in accessible language and visually presented in an intuitive manner. The bulk of the book, which are the species accounts are put together with clear maps, beautiful artwork and largely free of technical jargon so that it will become a source of reference even to non-specialists who are curious to learn more about the region’s breeding birds. More on this later. To cull a few key facts, the book represents one of the biggest citizen science projects with data from around 120,000 field workers covering an area of 11 million square kilometres, with text written by 348 authors, with full accounts for 556 species and original artwork by 46 artists.
There will be plenty of book reviews that will dwell on the book’s academic merits, therefore let me focus on what I think is one of its strengths; to inform and entertain non-academics who will find it pleasurable to dip into from time to time to pick up some useful nuggets of information that will enrich their bird watching. On a beautifully sunny and mild winter Saturday, on the week of receiving my review copy, I went for a walk with my wife to the Stave Hill Ecology Park and the Russia Dock Woodland in the London Borough of Southwark, a precious, urban refuge for nature which is visited by hundreds of young families where adults and children connect with nature. The highlight of the walk, about half an hour before dusk, was a Song Thrush that sang at length confidently above the screams and laughter of children playing below. I was with my wife (not a birder, but I am on the case). We stopped to listen and I pointed out that it was a bird whose population has crashed precipitously in the UK and this was the closest location to where we lived where we could hear a Song Thrush. Conversations of strangers walking past discussing furlough and redundancy in the Covid pandemic strayed into the soundscape dominated by the singing Song Thrush with a backdrop of vocalisations from Blue and Great Tits, Dunnock, Wren and a Ring-necked Parakeet screeching past. Back home we looked up EBBA2. In the text there were two insights to its behaviour that I had not thought about much before and which a typical field guide would not have space for. The Song Thrush sings mainly in the evenings. Furthermore, it stops singing once it has paired. Two aspects that also make it harder to census. Perusing the ‘Probability of occurrence’ map, I was surprised to see the densest colouring was in Scandinavia. I had not really thought of it as a bird of Northern forests. Curiously, it was conspicuously absent south of the Iberian Peninsula. When I think back on it, during my last holiday in Portugal in an area bordering the Mediterranean Sea I had listened to a Mistle Thrush sing, but I had not seen or heard any Song Thrushes. On our walk at Stave Hill, I had also pointed out flocks of wintering Redwings. The ‘Probability of occurrence’ map confirmed what I had explained earlier to my wife about the birds wintering in Britain originating in Iceland or Northwestern Europe.
The purpose of my little story above is to reinforce my comments that despite the heavy-duty science and statistical modelling behind the visualisation, this is a book that will have relevance to a wide audience. This will include even those whose bird watching is focussed on their walks in a local town park. Nature reserve wardens and those who write interpretation material will find plenty of interesting information to harvest from this book. The political map on the inside front cover and ‘Interpreting species accounts’ on page 66 to 67 are the only sets of pages most people will need to enjoy this book. The useful discussion on modelling techniques and census methods in the introductory sections can be left to the scientists. Travelling birders will find the ‘Species and habitats’ section on pages 48 to 61 of interest. This covers a variety of habitats and has text boxes on regions (e.g. Pannonian Region, Steppic Region, Anatolian Region etc.)
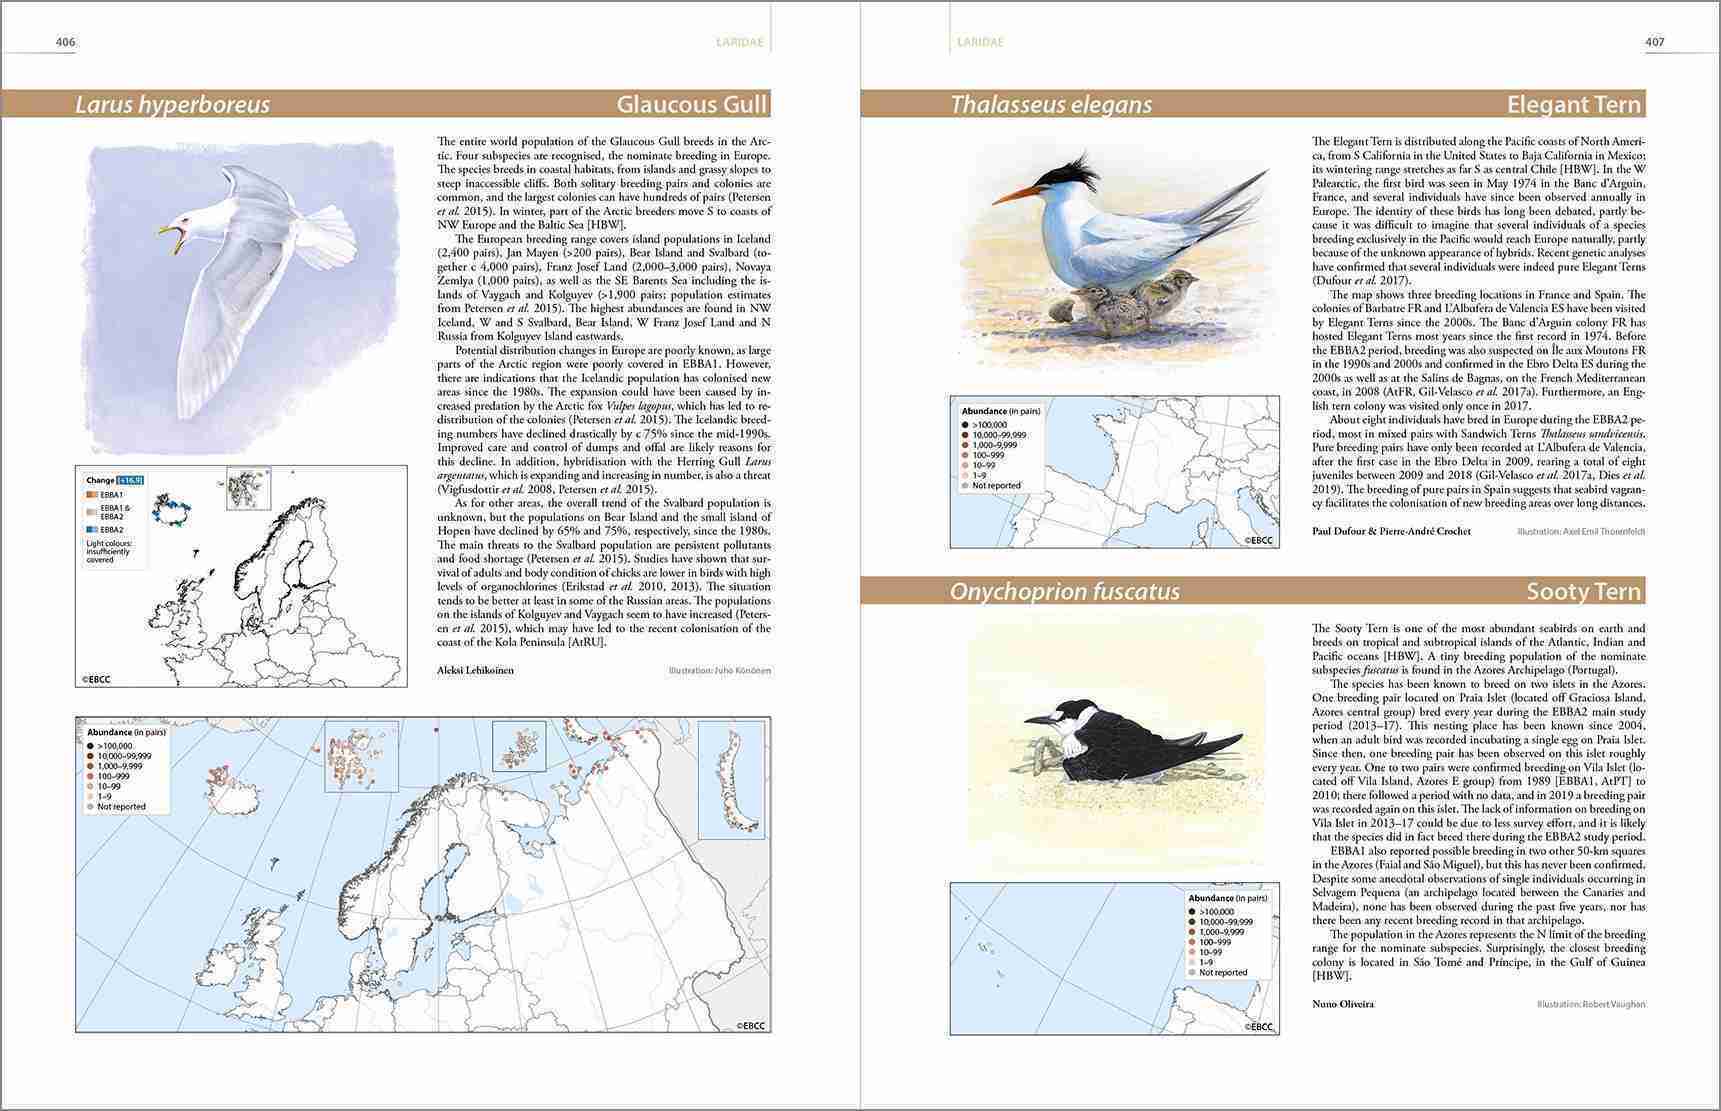
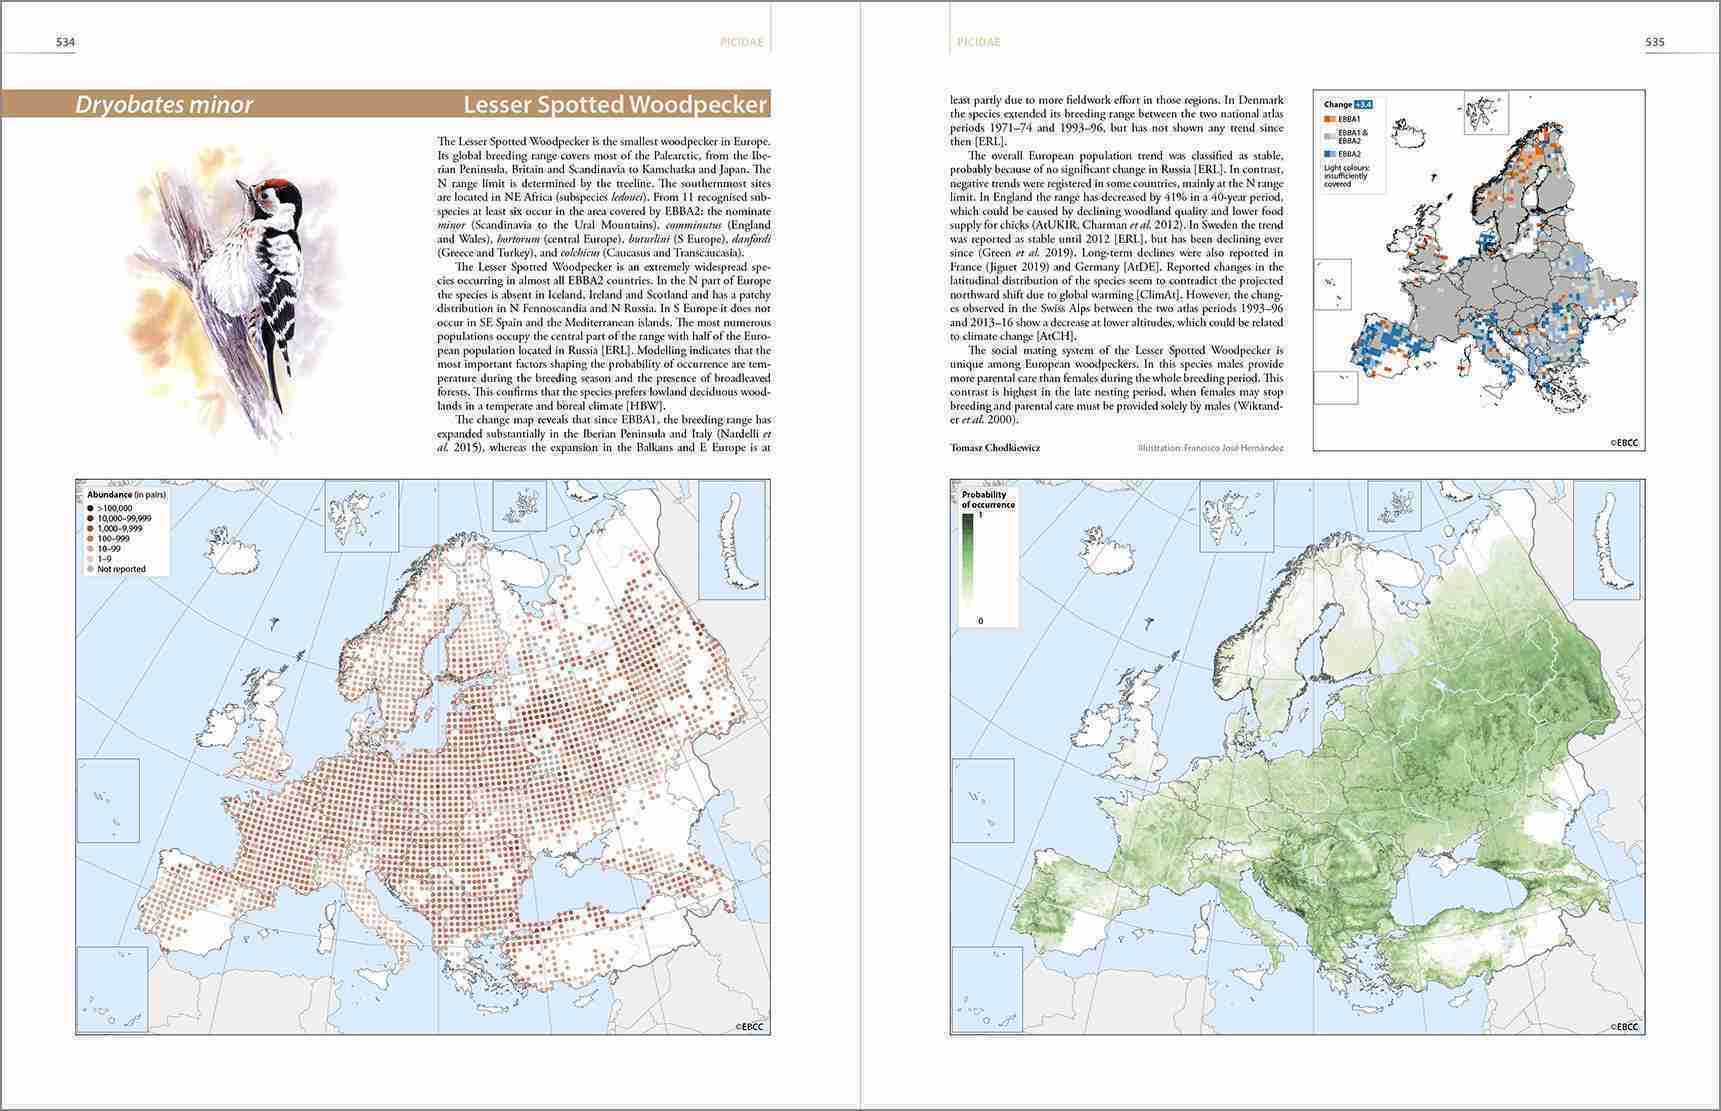
The ‘Species accounts’ vary from a full page to a generous two pages which contribute to a beast of a large format (24 × 31 cm) book weighing in at 5kg with 967 pages. In the large majority of the species the maps are to a large size and are easy to examine. All of the main species accounts have a ‘dot map’ showing the abundance in pairs on a 50 x 50km grid. Some species have a breeding evidence dot map which indicates the highest category (e.g. confirmed, probable) recorded for the grid. Some species have a probability of occurrence (0 to 1) instead of a breeding evidence dot map, which is in the familiar ‘heat map’ style, albeit shaded in green. The abundance dot maps, breeding evidence dot maps and probability of occurrence maps occupy over half the page area. A smaller change map, included with most accounts, is fairly easy to intuit with grey (no change), blue (increase) and orange (decrease) colour coding. Given the space occupied by the maps and a small illustration, the word count of the text descriptions is therefore comparatively modest but of a length that lends itself to being read in full during periodic bouts of dipping into the book.
The 66 pages of introductory material include a detailed discussion on methods (pages 23 to 39), and overviews of the patterns of distribution and change (pages 42 to 65). The species accounts are the bulk of the book (pages 69 to 881) followed by three appendices and extensive references (pages 912-959).
Although I was not one of the three authors, I can still remember when as Chair of the London Bird Club (a section of the London Natural History Society) all of my available free time appeared to be consumed with my behind the scenes project coordination for the last London Bird Atlas which was published in 2017. As a result, I suspect I am more attuned to appreciating the enormity and scale of EBBA2. A book like this is the fruition of a series of parallel project streams from coordinating field workers, data gathering, mapping, fund raising and the eventual publication. It has been a good call by the European Bird Census Council to work with a publisher that is practised in taking science to a wider audience.
hypercolius –
This is a fantastic book. I’m an enthusiastic birdwatcher of immense interest to who was the distribution of birds in Europe. I have been waiting for an updated atlas like this for a very long time and was not disappointed! Delightful to use to find out more about a bird which you have just observed out in the field. I was particularly impressed by the section on day-flying raptors