European Breeding Bird Atlas 2Distribution, Abundance and Change
El precio original era: $115.20.$86.40El precio actual es: $86.40.
Autores
En stock
El precio original era: $115.20.$86.40El precio actual es: $86.40.
Este libro presenta información sobre todas las especies de las que se tiene constancia que se reprodujeron en el periodo estudiado. Se trata un total de 556 especies con una descripción completa que incluye mapas, texto y una ilustración.
Publicado en colaboración entre el Consejo Europeo del Censo de Aves (EBCC) y Lynx Edicions
Código de producto: ALT0010
ISBN: 978-84-16728-38-1
SKU: ALT0010 Categorías: Aves, Obras de referencia, Paleártica Etiqueta: Más vendidosPeso
5 kg
Dimensiones
24 × 31 cm
Idioma
Inglés
Formato
Tapa dura
Páginas
967
Fecha de publicación
December 2020
Publicado por
Lynx Edicions
Autores
Descripción
Determinar correctamente dónde se encuentran las aves en este mundo cambiante es de vital importancia para su conservación, y hacerlo a escala continental es algo que sólo puede lograrse con una firme voluntad de cooperación internacional. Para ello, el Consejo Europeo del Censo de Aves (EBCC) se organiza como una red de ornitólogos expertos que impulsan el trabajo de los atlas de aves en toda Europa.
El primer Atlas Europeo de Aves Reproductoras (EBBA1) publicado por el EBCC en 1997 fue un hito en la ornitología europea. El proyecto del segundo Atlas Europeo de Aves Reproductoras (EBBA2) fue llevado a cabo por la red EBCC de organizaciones asociadas de 48 países. En total, unos 120.000 trabajadores de campo aportaron datos al atlas, la gran mayoría de ellos de forma voluntaria. Como tal, este proyecto constituye uno de los mayores proyectos de ciencia ciudadana sobre biodiversidad jamás realizados. La recogida y el análisis de datos siguieron un riguroso protocolo científico, dirigido por un equipo de investigadores de institutos ornitológicos con muchos años de experiencia en la elaboración de atlas.
El enorme esfuerzo de trabajo de campo dio como resultado una cobertura geográfica sin precedentes para un atlas de biodiversidad en Europa, incluidas todas las zonas hasta los Montes Urales y el Mar Caspio que no estaban bien cubiertas para el EBBA1. Estos datos se recogieron principalmente para el periodo comprendido entre 2013 y 2017.
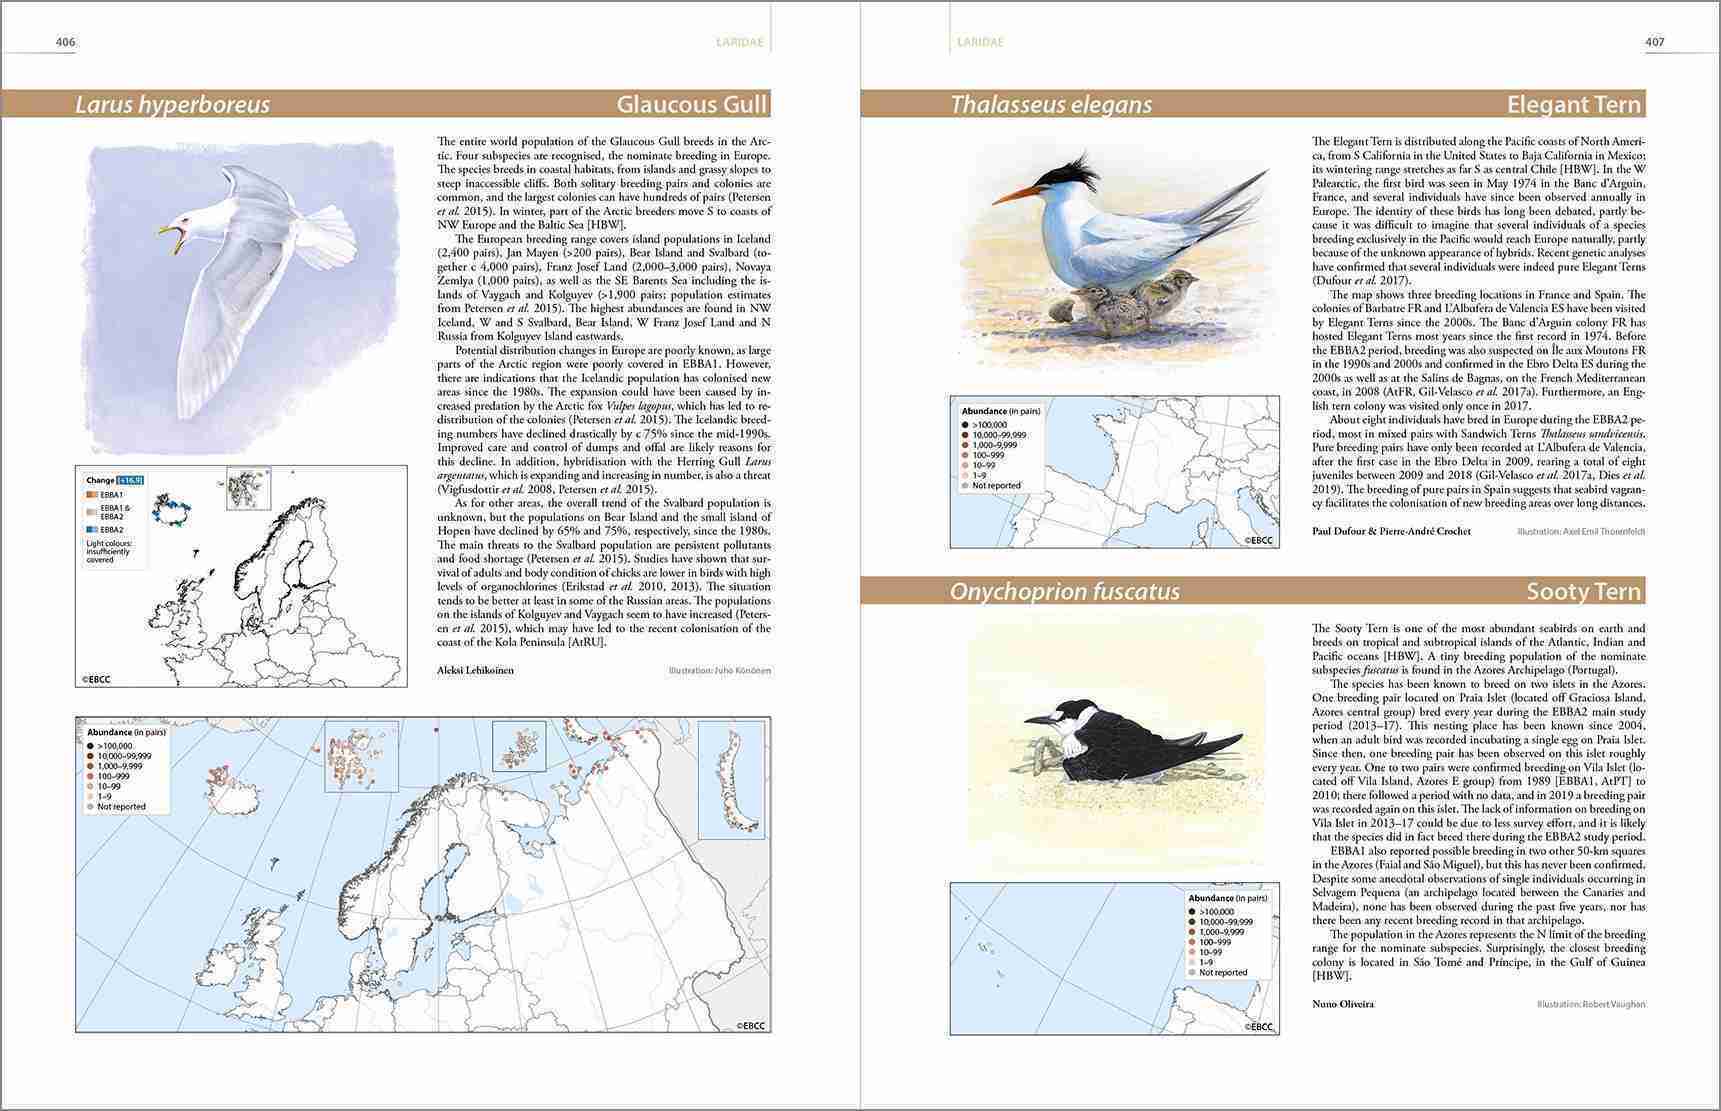
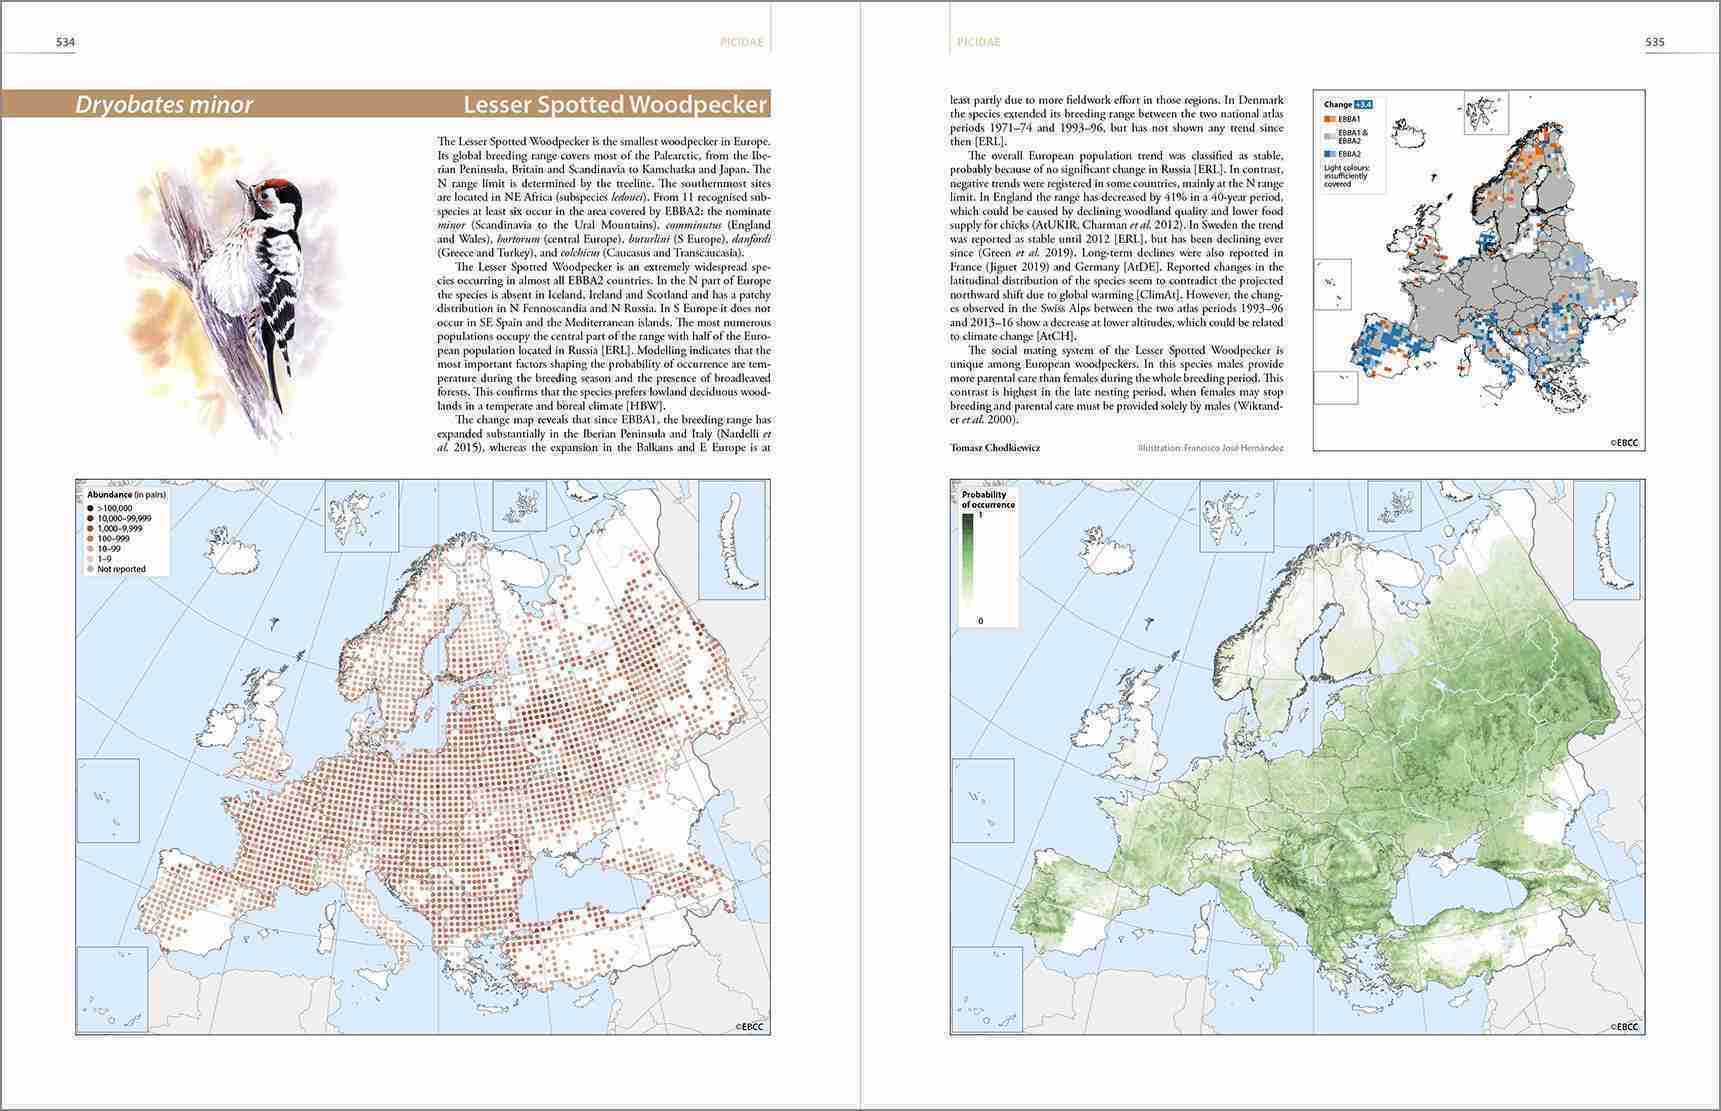
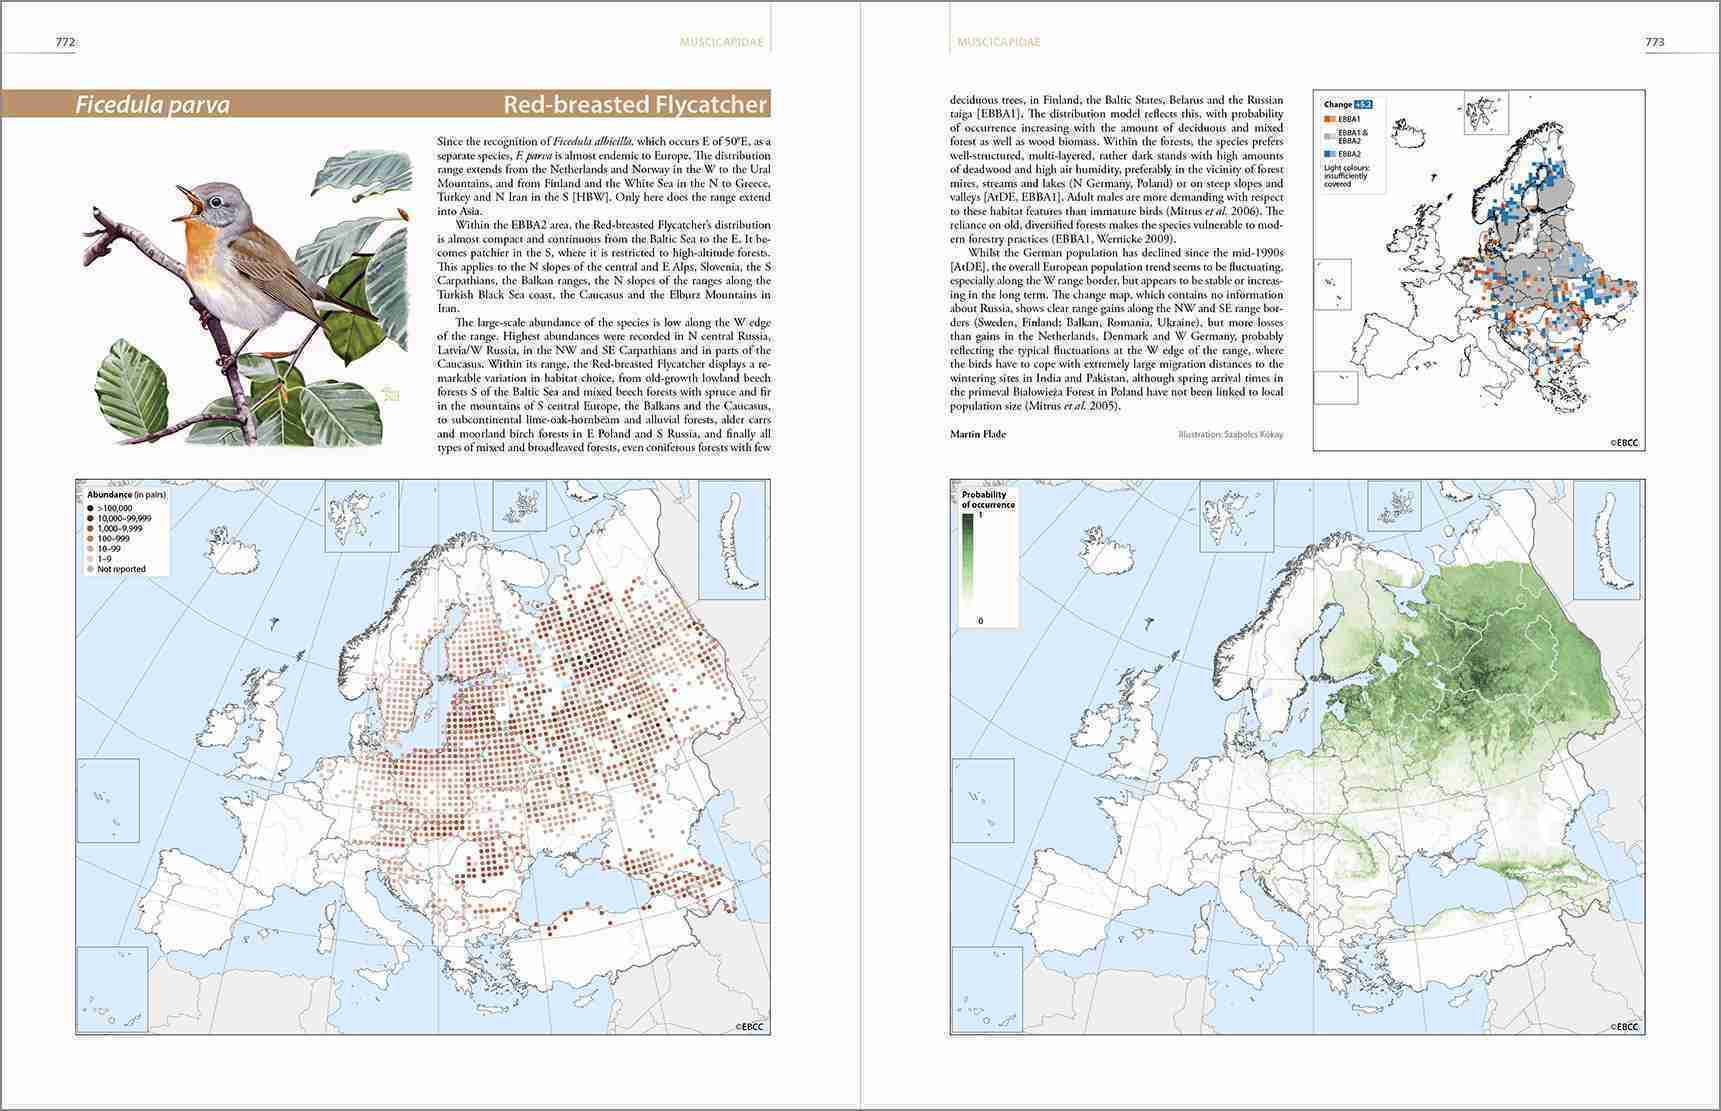
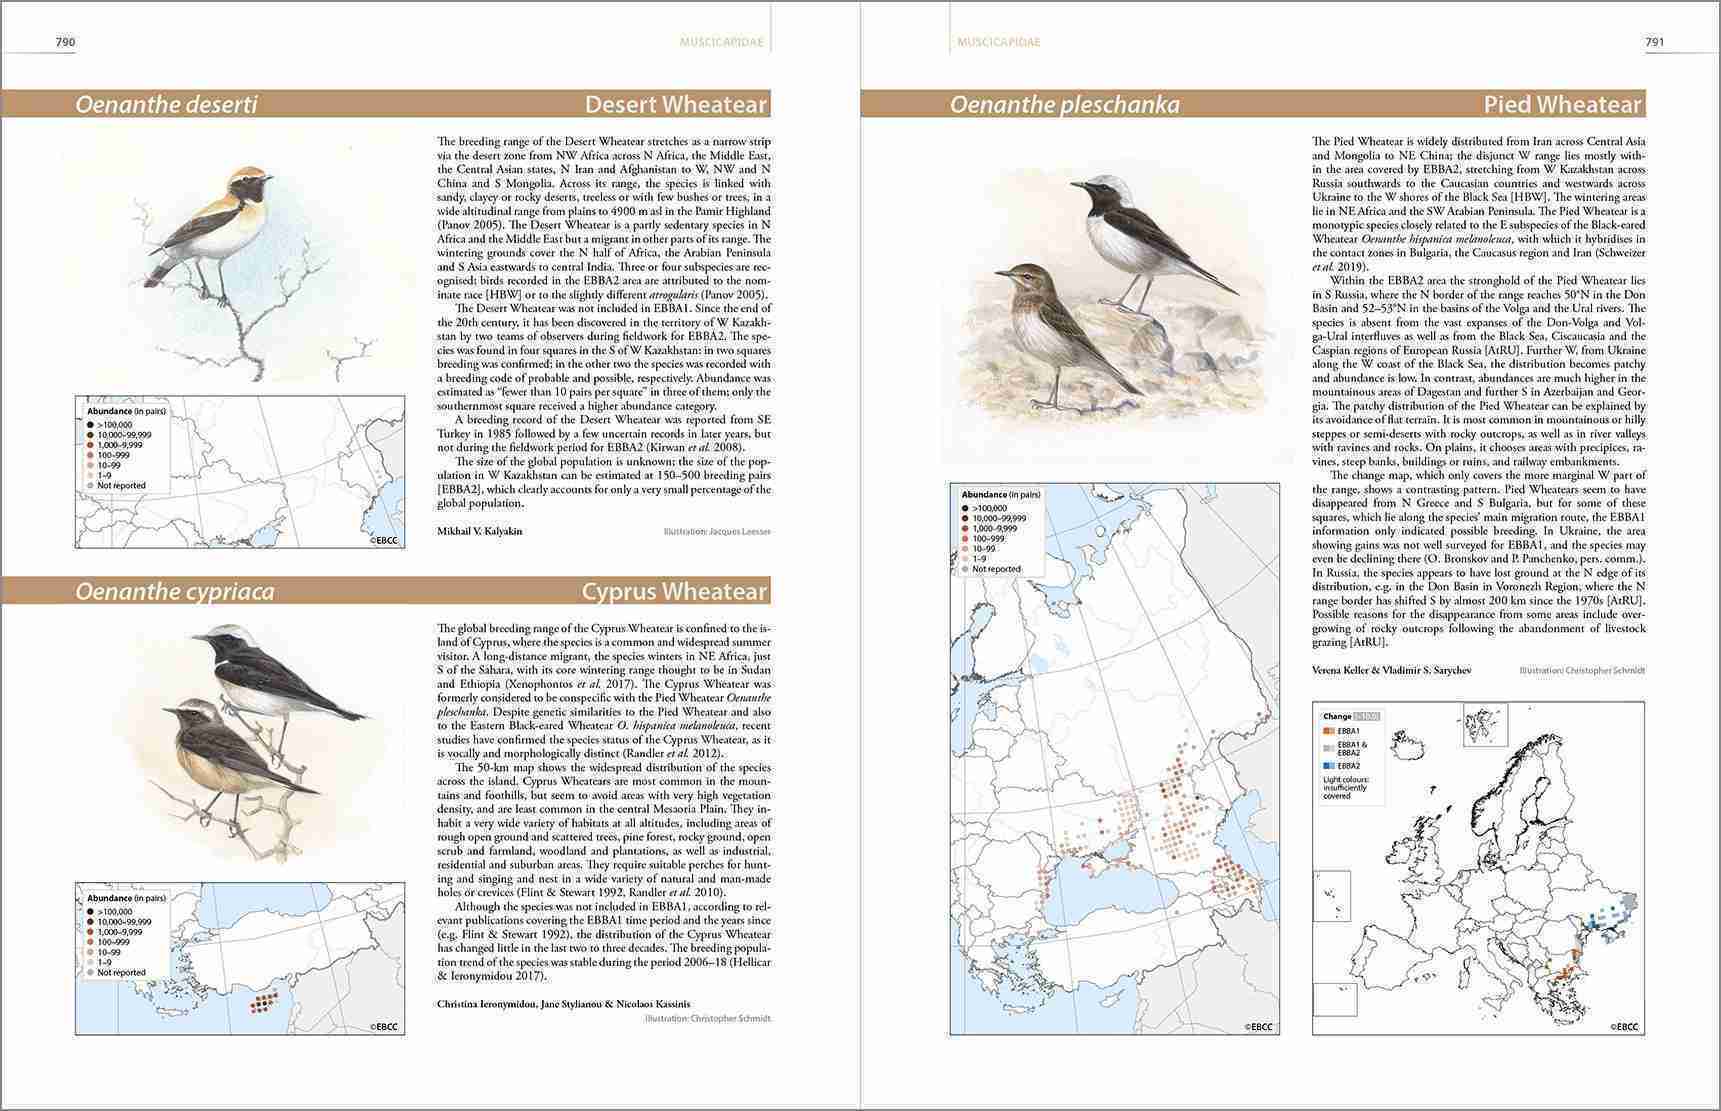
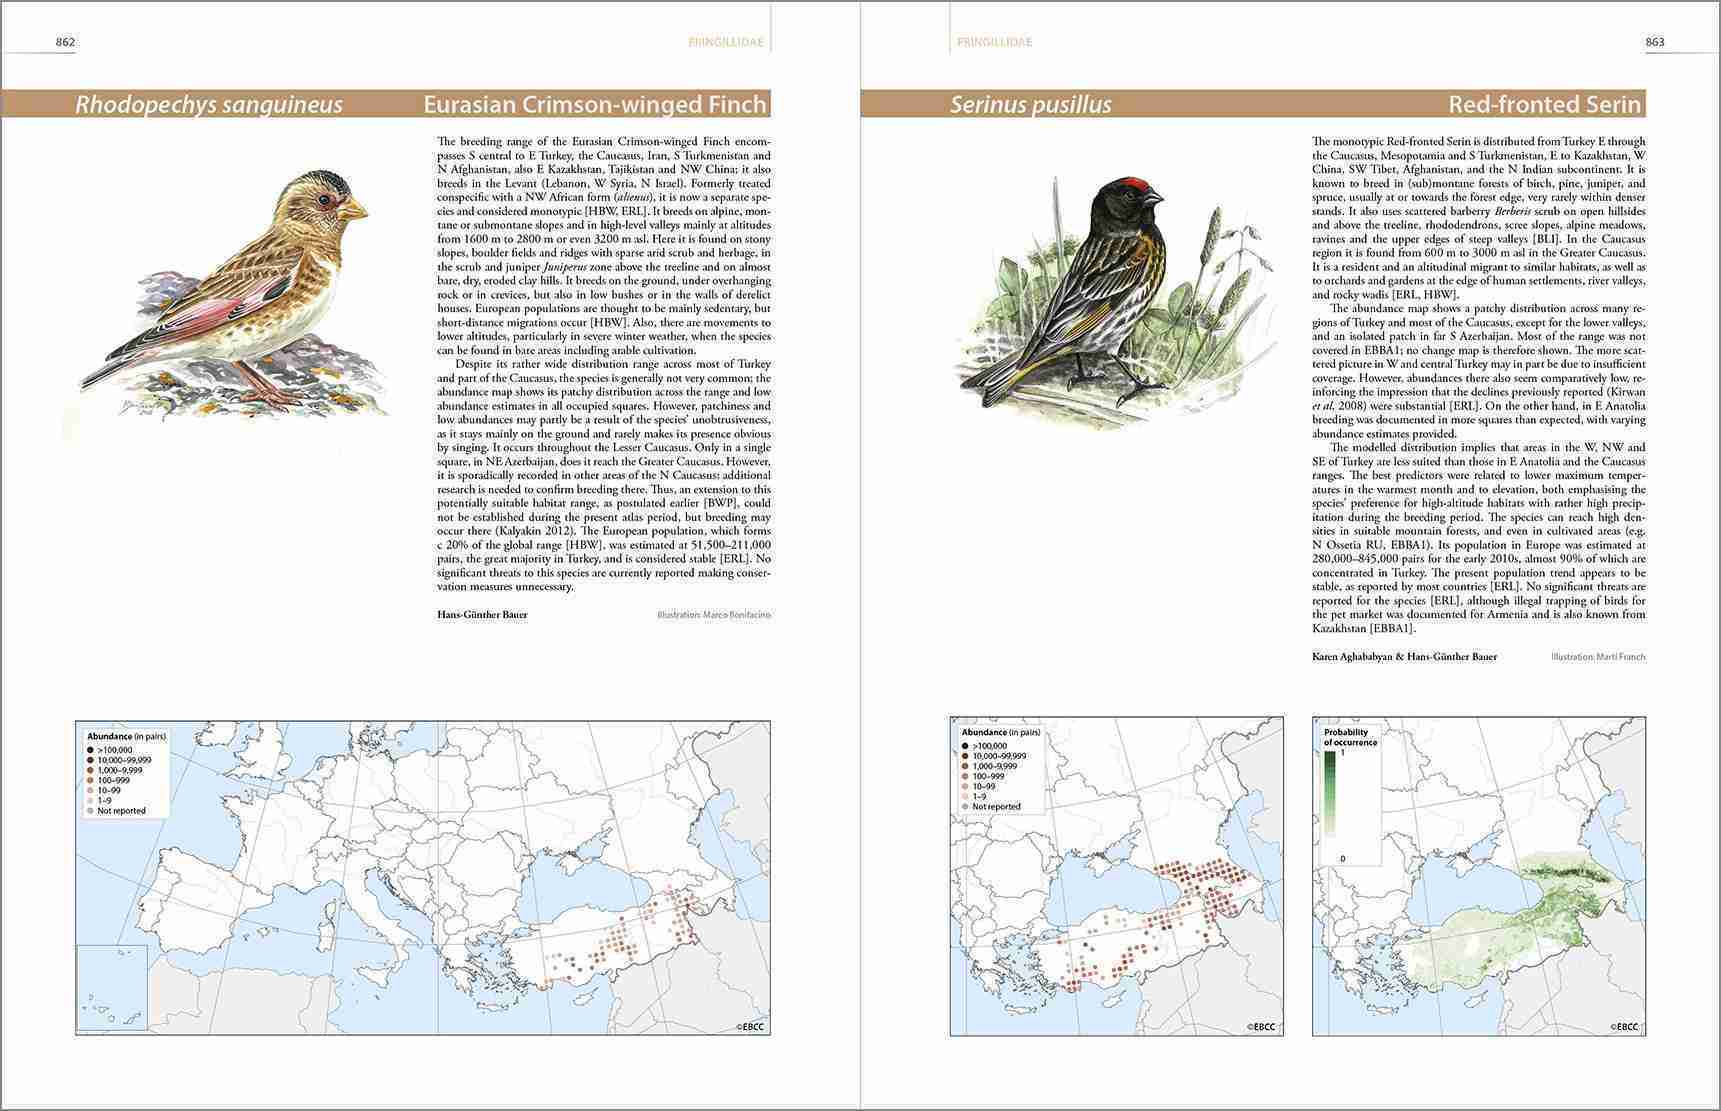
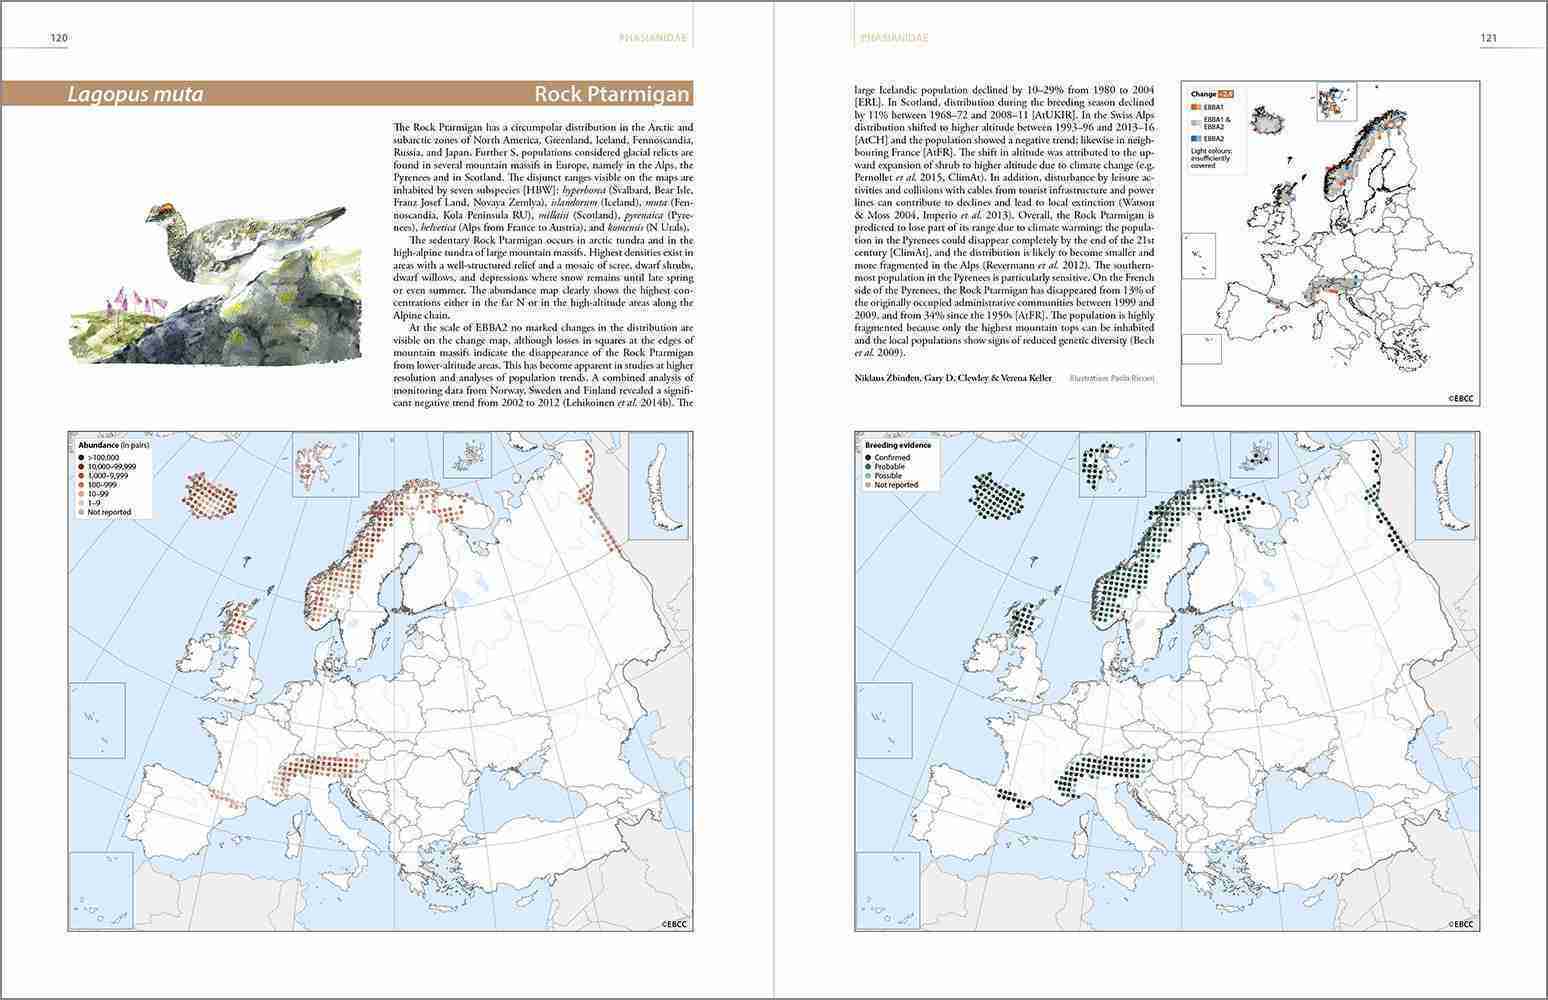
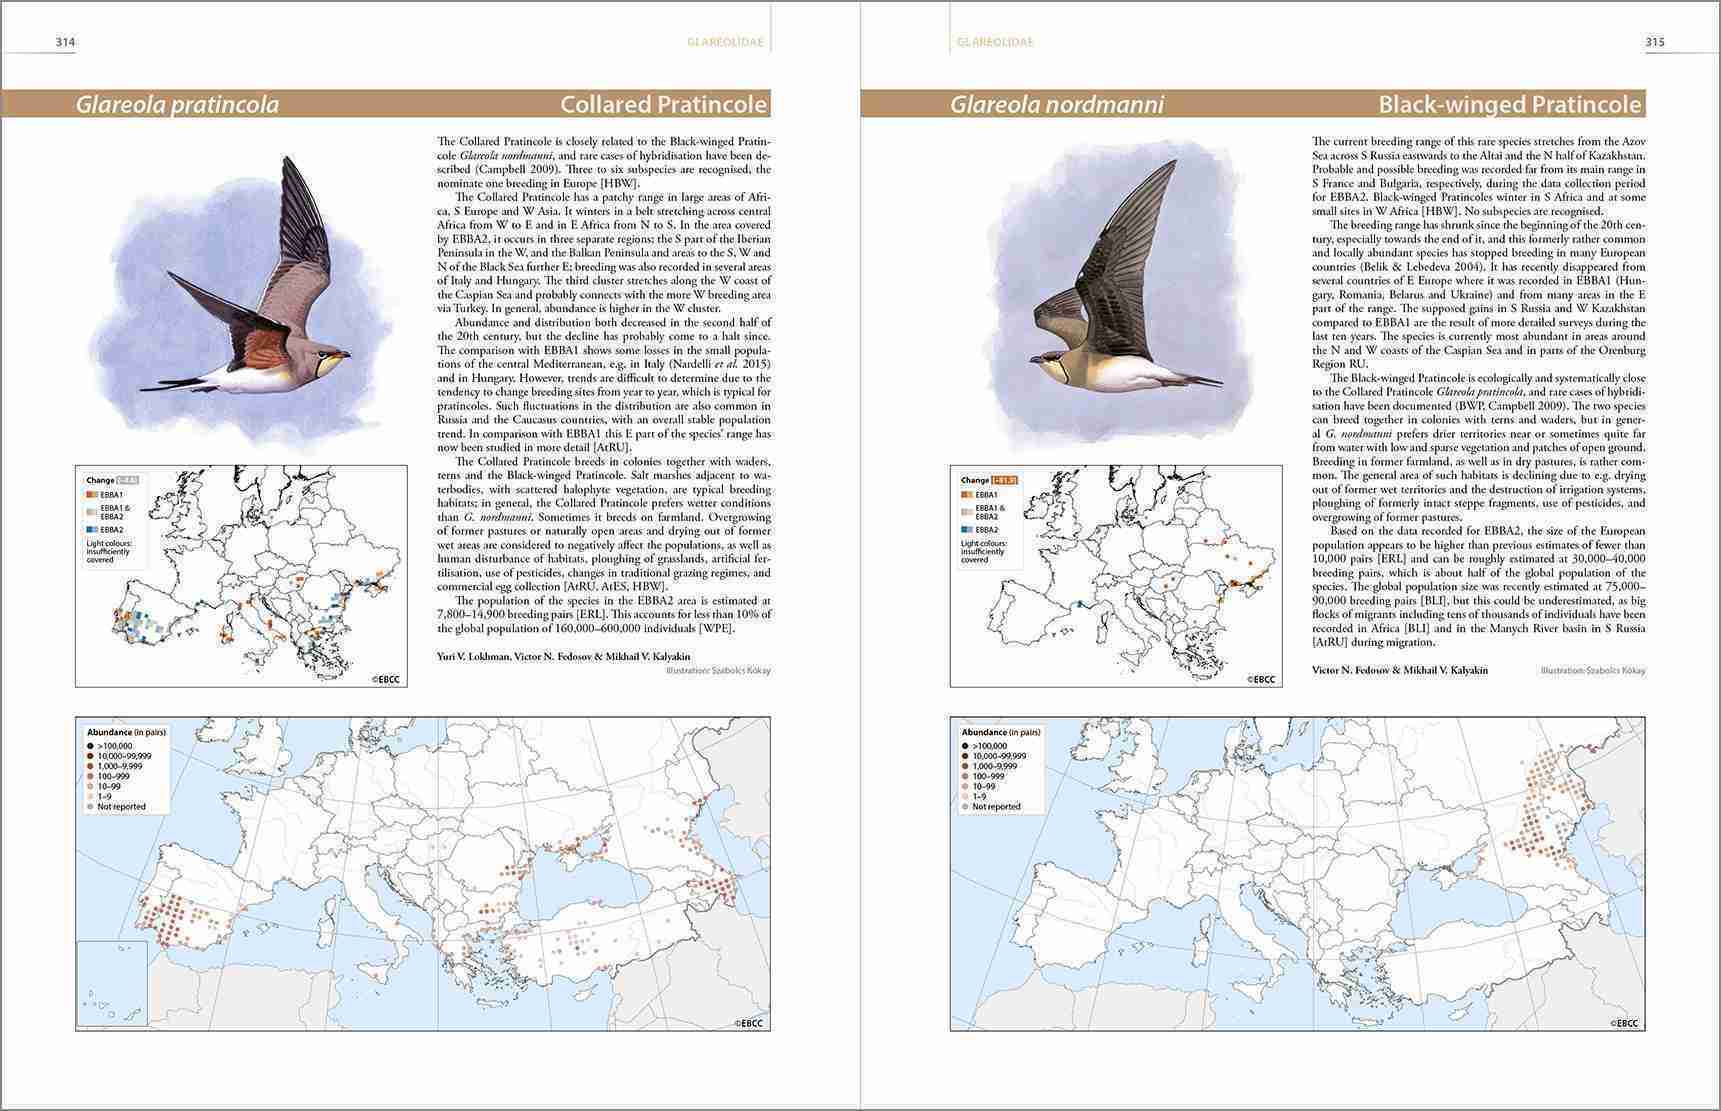
El libro presenta información sobre todas las especies de las que se tiene constancia que se reprodujeron en el periodo de estudio y algunas con un estatus reproductor más incierto. Se trata un total de 556 especies, con una descripción completa que incluye mapas, texto y una ilustración; en un Apéndice se presenta información sobre 69 especies muy raras o de reproducción irregular. Las descripciones completas de las especies incluyen mapas de distribución con una resolución de 50×50 km (que suelen mostrar datos de abundancia), mapas de distribución modelizados con una resolución de 10×10 km (para 222 aves reproductoras) y mapas de cambio que documentan los cambios en la distribución desde el primer atlas.
Obras de arte originales ilustran todas las especies con una descripción completa. Las ilustraciones corrieron a cargo de 46 artistas de 18 países, con estilos y técnicas diferentes, reflejo de la diversidad europea.
Este libro representa la fuente de información más actualizada sobre la distribución y el cambio de las aves en Europa, y una gran contribución al objetivo global de comprender la biodiversidad para garantizar su conservación.
2 valoraciones en European Breeding Bird Atlas 2Distribution, Abundance and Change
Related Books
GUÍAS DE CAMPO
GUÍAS DE CAMPO DE BIRDLIFE INTERNATIONAL


Gehan de Silva Wijeyeratne –
The European Breeding Atlas 2: Distribution, Abundance and Change (EBBA2) is destined to become one of the most heavily cited ornithological publications in the European region. Spanning 48 countries, it is a monumental work and will be a key baseline that informs future conservation policy and actions. Although it is a data-centric publication with data collected in a standardised and systematic manner, the information has been written in accessible language and visually presented in an intuitive manner. The bulk of the book, which are the species accounts are put together with clear maps, beautiful artwork and largely free of technical jargon so that it will become a source of reference even to non-specialists who are curious to learn more about the region’s breeding birds. More on this later. To cull a few key facts, the book represents one of the biggest citizen science projects with data from around 120,000 field workers covering an area of 11 million square kilometres, with text written by 348 authors, with full accounts for 556 species and original artwork by 46 artists.
There will be plenty of book reviews that will dwell on the book’s academic merits, therefore let me focus on what I think is one of its strengths; to inform and entertain non-academics who will find it pleasurable to dip into from time to time to pick up some useful nuggets of information that will enrich their bird watching. On a beautifully sunny and mild winter Saturday, on the week of receiving my review copy, I went for a walk with my wife to the Stave Hill Ecology Park and the Russia Dock Woodland in the London Borough of Southwark, a precious, urban refuge for nature which is visited by hundreds of young families where adults and children connect with nature. The highlight of the walk, about half an hour before dusk, was a Song Thrush that sang at length confidently above the screams and laughter of children playing below. I was with my wife (not a birder, but I am on the case). We stopped to listen and I pointed out that it was a bird whose population has crashed precipitously in the UK and this was the closest location to where we lived where we could hear a Song Thrush. Conversations of strangers walking past discussing furlough and redundancy in the Covid pandemic strayed into the soundscape dominated by the singing Song Thrush with a backdrop of vocalisations from Blue and Great Tits, Dunnock, Wren and a Ring-necked Parakeet screeching past. Back home we looked up EBBA2. In the text there were two insights to its behaviour that I had not thought about much before and which a typical field guide would not have space for. The Song Thrush sings mainly in the evenings. Furthermore, it stops singing once it has paired. Two aspects that also make it harder to census. Perusing the ‘Probability of occurrence’ map, I was surprised to see the densest colouring was in Scandinavia. I had not really thought of it as a bird of Northern forests. Curiously, it was conspicuously absent south of the Iberian Peninsula. When I think back on it, during my last holiday in Portugal in an area bordering the Mediterranean Sea I had listened to a Mistle Thrush sing, but I had not seen or heard any Song Thrushes. On our walk at Stave Hill, I had also pointed out flocks of wintering Redwings. The ‘Probability of occurrence’ map confirmed what I had explained earlier to my wife about the birds wintering in Britain originating in Iceland or Northwestern Europe.
The purpose of my little story above is to reinforce my comments that despite the heavy-duty science and statistical modelling behind the visualisation, this is a book that will have relevance to a wide audience. This will include even those whose bird watching is focussed on their walks in a local town park. Nature reserve wardens and those who write interpretation material will find plenty of interesting information to harvest from this book. The political map on the inside front cover and ‘Interpreting species accounts’ on page 66 to 67 are the only sets of pages most people will need to enjoy this book. The useful discussion on modelling techniques and census methods in the introductory sections can be left to the scientists. Travelling birders will find the ‘Species and habitats’ section on pages 48 to 61 of interest. This covers a variety of habitats and has text boxes on regions (e.g. Pannonian Region, Steppic Region, Anatolian Region etc.)
The ‘Species accounts’ vary from a full page to a generous two pages which contribute to a beast of a large format (24 × 31 cm) book weighing in at 5kg with 967 pages. In the large majority of the species the maps are to a large size and are easy to examine. All of the main species accounts have a ‘dot map’ showing the abundance in pairs on a 50 x 50km grid. Some species have a breeding evidence dot map which indicates the highest category (e.g. confirmed, probable) recorded for the grid. Some species have a probability of occurrence (0 to 1) instead of a breeding evidence dot map, which is in the familiar ‘heat map’ style, albeit shaded in green. The abundance dot maps, breeding evidence dot maps and probability of occurrence maps occupy over half the page area. A smaller change map, included with most accounts, is fairly easy to intuit with grey (no change), blue (increase) and orange (decrease) colour coding. Given the space occupied by the maps and a small illustration, the word count of the text descriptions is therefore comparatively modest but of a length that lends itself to being read in full during periodic bouts of dipping into the book.
The 66 pages of introductory material include a detailed discussion on methods (pages 23 to 39), and overviews of the patterns of distribution and change (pages 42 to 65). The species accounts are the bulk of the book (pages 69 to 881) followed by three appendices and extensive references (pages 912-959).
Although I was not one of the three authors, I can still remember when as Chair of the London Bird Club (a section of the London Natural History Society) all of my available free time appeared to be consumed with my behind the scenes project coordination for the last London Bird Atlas which was published in 2017. As a result, I suspect I am more attuned to appreciating the enormity and scale of EBBA2. A book like this is the fruition of a series of parallel project streams from coordinating field workers, data gathering, mapping, fund raising and the eventual publication. It has been a good call by the European Bird Census Council to work with a publisher that is practised in taking science to a wider audience.
hypercolius –
This is a fantastic book. I’m an enthusiastic birdwatcher of immense interest to who was the distribution of birds in Europe. I have been waiting for an updated atlas like this for a very long time and was not disappointed! Delightful to use to find out more about a bird which you have just observed out in the field. I was particularly impressed by the section on day-flying raptors